
Coverage map
Coverage map
Coverage map
Enterprise AI Suite to provide seamless and efficient AI Research and optimize usage of computing resources
Enterprise AI Suite to provide seamless and efficient AI Research and optimize usage of computing resources
Enterprise AI Suite to provide seamless and efficient AI Research and optimize usage of computing resources

Details
Role:
Role:
Lead Product Designer
Service:
Service:
Enterprise AI Suite
AI Dev Tools
Date:
Date:
Jan. 2019 - Aug. 2019
Overview
Yennefer Suite is 5 in 1 enterprise AI platform that serves AI search to get valuable insights from massive data and manage an organization's AI projects. I was the only designer in this startup company and led the entire design thinking process from research to launch. Currently, Yennefer is being used by 9 enterprise organizations including Samsung Display, KT Telecom, Hyundai, Seoul National University, and the State University of New York.
Yennefer Suite is 5 in 1 enterprise AI platform that serves AI search to get valuable insights from massive data and manage an organization's AI projects. I was the only designer in this startup company and led the entire design thinking process from research to launch. Currently, Yennefer is being used by 9 enterprise organizations including Samsung Display, KT Telecom, Hyundai, Seoul National University, and the State University of New York.
Yennefer Suite is 5 in 1 enterprise AI platform that serves AI search to get valuable insights from massive data and manage an organization's AI projects. I was the only designer in this startup company and led the entire design thinking process from research to launch. Currently, Yennefer is being used by 9 enterprise organizations including Samsung Display, KT Telecom, Hyundai, Seoul National University, and the State University of New York.
Outcome in glance
Outcome in glance
Outcome in glance
Increased coverage map usability by 35% and comprehensiveness by 65%
Increased coverage map usability by 35% and comprehensiveness by 65%
Increased coverage map usability by 35% and comprehensiveness by 65%
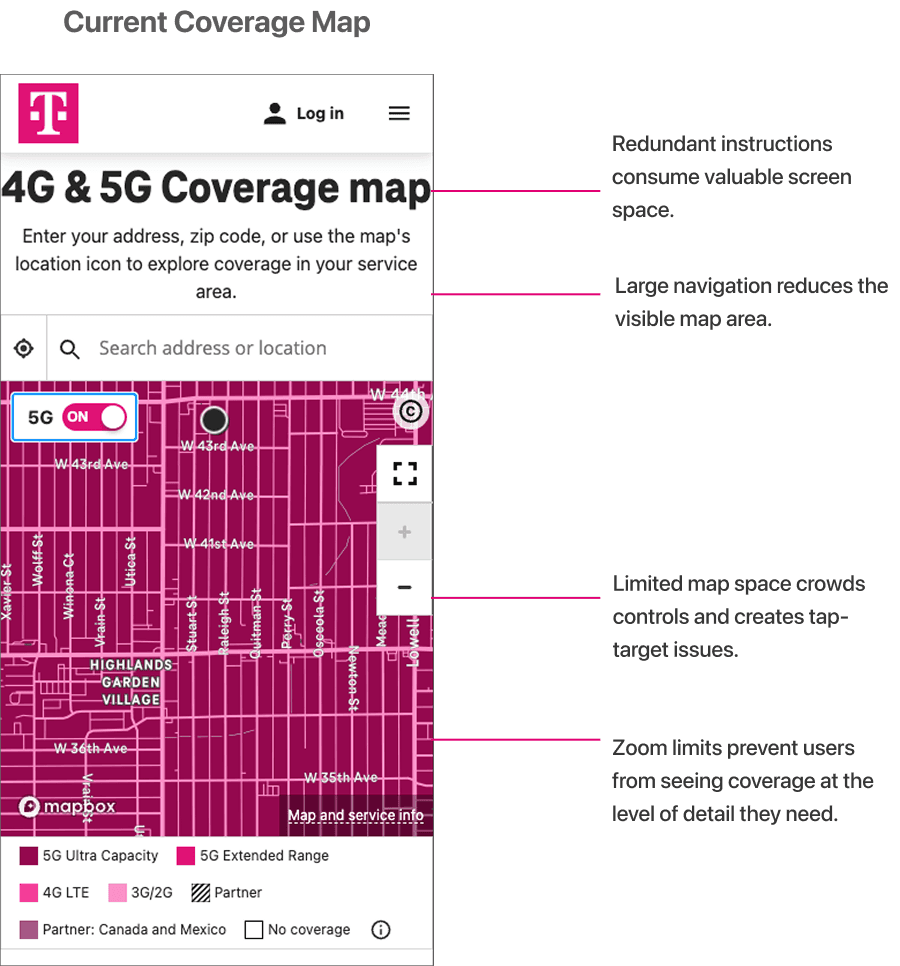
Before
Limited Map Usability
Low Map Comprehension
Before
Limited Map Usability
Low Map Comprehension
Before
Limited Map Usability
Low Map Comprehension

After ✨
+ 35% Map usability
+ 65% Map Comprehension
After ✨
+ 35% Map usability
+ 65% Map Comprehension
After ✨
+ 35% Map usability
+ 65% Map Comprehension

Research
Research
Research
BACKGROUND
BACKGROUND
Why the Coverage Map matters?
Why the Coverage Map matters?
Why the Coverage Map matters?
6.2M people visit the coverage map each year. 3.6M of them are prospective customers considering switching to T-Mobile.
6.2M people visit the coverage map each year. 3.6M of them are prospective customers considering switching to T-Mobile.
6.2M people visit the coverage map each year. 3.6M of them are prospective customers considering switching to T-Mobile.

PROBLEM
PROBLEM
PROBLEM
Despite its high traffic, the coverage map had a 55% high churn rate because users struggled to understand the map.
Despite its high traffic, the coverage map had a 55% high churn rate because users struggled to understand the map.
Despite its high traffic, the coverage map had a 55% high churn rate because users struggled to understand the map.
USER RESEARCH
USER RESEARCH
USER RESEARCH
Key research findings
Key research findings
Key research findings
🗺️
🗺️
🗺️
Poor visualization
Poor visualization
Poor visualization
Users struggled to interpret coverage layers and map details.
Users struggled to interpret coverage layers and map details.
Users struggled to interpret coverage layers and map details.
📑
📑
📑
Indigestible information
Indigestible information
Indigestible information
Technical terms and complex legends made the information difficult to understand.
Technical terms and complex legends made the information difficult to understand.
Technical terms and complex legends made the information difficult to understand.
🎁
🎁
🎁
Unclear user value
Unclear user value
Unclear user value
Users couldn’t confidently answer the key question: “Will T-Mobile work for me?”
Users couldn’t confidently answer the key question: “Will T-Mobile work for me?”
Users couldn’t confidently answer the key question: “Will T-Mobile work for me?”
Design Process
Design Process
Design Process
DESIGN PROCESS
DESIGN PROCESS
DESIGN PROCESS
Multiple tests and iterations
Multiple tests and iterations
Based on user research insights and stakeholders feedback, I improved the design
Based on user research insights and stakeholders feedback, I improved the design

1st Problem
Poor Visualization
1st Problem
Poor Visualization
1st Problem
Poor Visualization
Solution
Early Iteration

Solution
Early Iteration
Solution
Early Iteration
Improvement
MVP Final Design

Improvement
MVP Final Design
Improvement
MVP Final Design
Final Design
Final Design
Final Design
SOLUTION
SOLUTION
SOLUTION
Improved coverage map across the platform
Improved coverage map across the platform
Improved coverage map across the platform

Mobile
Mobile
Mobile

Responsive web
Responsive web
Responsive web
MVP KPIs
MVP KPIs
MVP KPIs
New coverage map design positively impacted both users and business
New coverage map design positively impacted both users and business
New coverage map design positively impacted both users and business
%
%
%
increased in ease of use
increased in ease of use
Unlike T-Mobile current platform, 3 different user groups were able to complete their tasks without any mobile expert’s support
Unlike T-Mobile current platform, 3 different user groups were able to complete their tasks without any mobile expert’s support
Unlike T-Mobile current platform, 3 different user groups were able to complete their tasks without any mobile expert’s support
%
%
%
Increased in map comprehension
Increased in comprehension
From collect required information or complete a task, total decision making time reduced from 12.5m to 2.5m
From collect required information or complete a task, total decision making time reduced from 12.5m to 2.5m
From collect required information or complete a task, total decision making time reduced from 12.5m to 2.5m
%
%
%
Boost in trust
Boost in trust
Digital Innovation Lab’s success metric is make conceptual idea to production
Digital Innovation Lab’s success metric is make conceptual idea to production
Digital Innovation Lab’s success metric is make conceptual idea to production
Before
Limited Map Usability
Low Map Comprehension
Before
Limited Map Usability
Low Map Comprehension
Before
Limited Map Usability
Low Map Comprehension
After ✨
+ 35% Map usability
+65% Map Comprehension
After ✨
+ 35% Map usability
+65% Map Comprehension
After ✨
+ 35% Map usability
+65% Map Comprehension

