ENTERPRISE AI SUITE
ENTERPRISE AI SUITE
Enterprise AI Suite to provide seamless and efficient AI Research and optimize usage of computing resources

Details
Details
Details
Role:
Role:
Lead Product Designer
Design System
Service:
Service:
Enterprise AI Suite
AI Dev Tools
Date:
Date:
Jan. 2019 - Aug. 2019
Overview
Overview
Overview
Yennefer Suite is 5 in 1 enterprise AI platform that serves AI search to get valuable insights from massive data and manage an organization's AI projects. I was the only designer in this startup company and led the entire design thinking process from research to launch. Currently, Yennefer is being used by 9 enterprise organizations including Samsung Display, KT Telecom, Hyundai, Seoul National University, and the State University of New York.
Yennefer Suite is 5 in 1 enterprise AI platform that serves AI search to get valuable insights from massive data and manage an organization's AI projects. I was the only designer in this startup company and led the entire design thinking process from research to launch. Currently, Yennefer is being used by 9 enterprise organizations including Samsung Display, KT Telecom, Hyundai, Seoul National University, and the State University of New York.
Yennefer Suite is 5 in 1 enterprise AI platform that serves AI search to get valuable insights from massive data and manage an organization's AI projects. I was the only designer in this startup company and led the entire design thinking process from research to launch. Currently, Yennefer is being used by 9 enterprise organizations including Samsung Display, KT Telecom, Hyundai, Seoul National University, and the State University of New York.
Impact
Impact
Impact
%
%
%
Increased company revenue
Increased company revenue
%
%
%
Increased AI Research efficiency
Increased AI Research efficiency
+
+
+
Adopted by enterprise companies
Adopted by enterprise companies
Adopted by enterprise companies
PROBLEM
PROBLEM
PROBLEM
The company had a half-made prototype without understanding users' needs
The company had a half-made prototype without understanding users' needs
The company had a half-made prototype without understanding users' needs

Existing prototype
1. Yennefer Studio
1. Yennefer Studio
1. Yennefer Studio
2. Data Catalog

2. Data Catalog
2. Data Catalog
3. AI Dev Tool

3. AI Dev Tool

3. AI Dev Tool
4. Resource Dashboard

4. Resource Dashboard

4. Resource Dashboard
Research
Research
PROCESS
PROCESS
PROCESS
End-to-end process with Start-up environment
End-to-end process with Start-up environment
End-to-end process with Start-up environment
I used 5 user research methods to understand the project’s goal, the enterprise AI platform’s trend, and AI researchers’ pain points. I aligned with our product management counterparts to develop design roadmaps and research plans.
I used 5 user research methods to understand the project’s goal, the enterprise AI platform’s trend, and AI researchers’ pain points. I aligned with our product management counterparts to develop design roadmaps and research plans.
I used 5 user research methods to understand the project’s goal, the enterprise AI platform’s trend, and AI researchers’ pain points. I aligned with our product management counterparts to develop design roadmaps and research plans.
Heuristic Evalution
Heuristic Evalution
Wireframes

10+ User interviews
10+ User interviews
AI Engineering

20+ Competitor analysis
20+ Competitor analysis
20+ Competitor analysis

KEY INSIGHTS
KEY INSIGHTS
KEY INSIGHTS
AI Researcher's pain points
AI Researcher's pain points
AI Researcher's pain points
❓
❓
❓
Irrelevant information
Irrelevant information
Irrelevant information
Lack of personalized and contextualized reponse
Lack of personalized and contextualized reponse
Lack of personalized and contextualized reponse
🧩
🧩
🧩
Optimize limited resources
Optimize limited resources
Optimize limited resources
Overwhelming information and decision paralysis
Overwhelming information and decision paralysis
Overwhelming information and decision paralysis
⏳
⏳
⏳
Time consuming
Time consuming
Time consuming
Inefficiency in communication and trust deficiency
Inefficiency in communication and trust deficiency
Inefficiency in communication and trust deficiency
DESIGN GOAL
DESIGN GOAL
DESIGN GOAL
How can we enhance the AI research experience by simplifying access to and management of resources?
How might we simplify resource access and management for AI researchers?
How can we enhance the AI research experience by simplifying access to and management of resources?
Design
Design
CHALLENGE 1
CHALLENGE 1
CHALLENGE 1
How to get a glance at project status?
How might users quickly understand project status?
How to get a glance at project status?
Based on interview findings, we defined the crucial information to get a glance project status.
The new platform went through many iterations before we had a shippable design candidate. As I unify platforms to one product, I added project lists and statuses, accessible data, and documentation ideas into the core wireframe and created a quick design prototype to test. After validation, I improved the design.
Based on user interviews, we identified the key information needed for a quick overview of project status.
As we unified multiple platforms into a single product, I introduced a centralized project list with clear status indicators, accessible data, and integrated documentation. I created rapid wireframes and a prototype to test the concept, then refined the design based on validation.
Based on interview findings, we defined the crucial information to get a glance project status.
The new platform went through many iterations before we had a shippable design candidate. As I unify platforms to one product, I added project lists and statuses, accessible data, and documentation ideas into the core wireframe and created a quick design prototype to test. After validation, I improved the design.
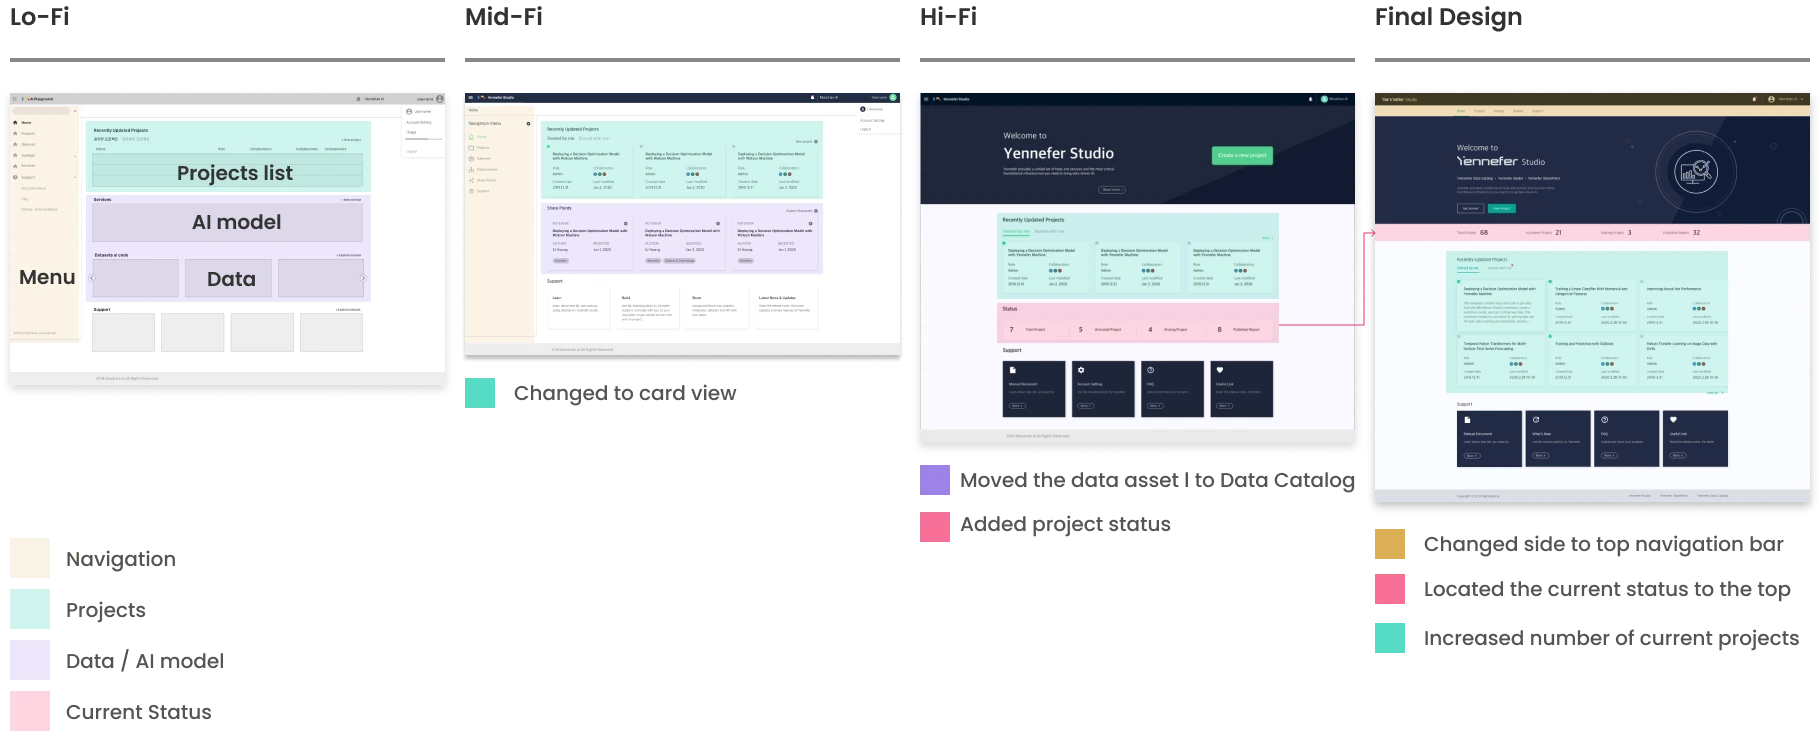
DESIGN DECISION 1
DESIGN DECISION 1
DESIGN DECISION 1
Easy access to all project status
Make project status easy to access
Easy access to all project status
1. Quick scan project status on the main page
1. Quick status overview on the main dashboard
1. Quick scan project status on the main page
2. Easy access to current project information and description
2. Fast access to project details and descriptions
2. Easy access to current project information and description

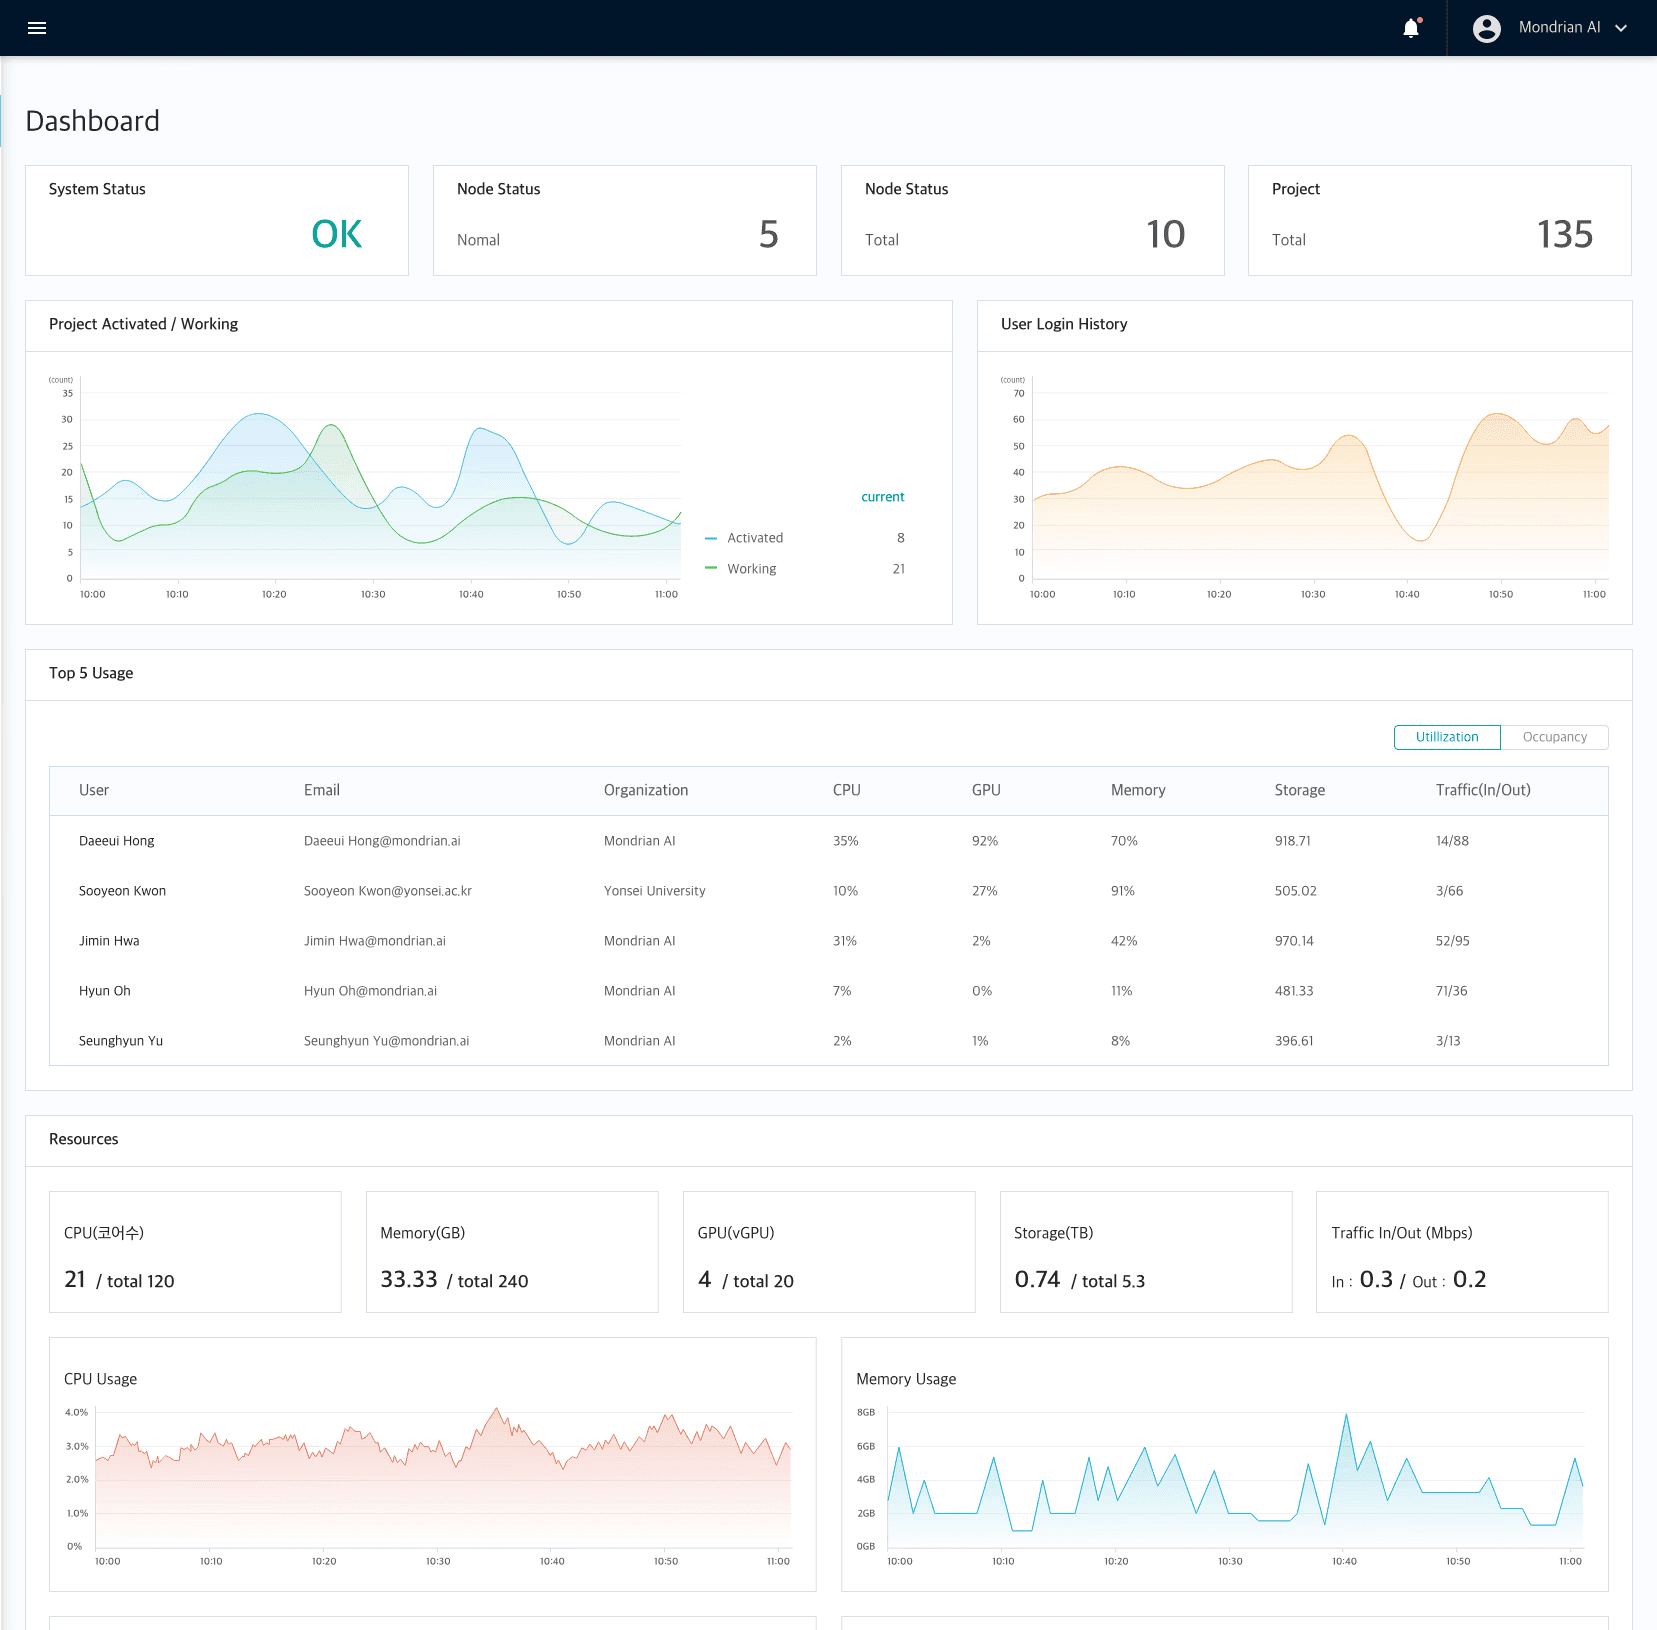
CHALLENGE 2
CHALLENGE 2
CHALLENGE 2
How to easily manage computing resources?
How to easily manage computing resources?
How to easily manage computing resources?
To evaluate our idea quickly through an MVP test, I defined key scenarios and features with PM. We had 3 weeks sprint to build a fully working demo application, including design, development, and QA test.
To evaluate our idea quickly through an MVP test, I defined key scenarios and features with PM. We had 3 weeks sprint to build a fully working demo application, including design, development, and QA test.
To evaluate our idea quickly through an MVP test, I defined key scenarios and features with PM. We had 3 weeks sprint to build a fully working demo application, including design, development, and QA test.
Option 1
Option 1
Wireframes

Option 2
Option 2
AI Engineering

✅ Option 3
✅ Option 3
✅ Option 3

Pros ✅:
The chart has the proper size for width and height to understand the data
Cons 🚫:
Computing resource data and charts are not aligned, so it’s not intuitive to understand
Pros ✅:
The chart has the proper size for width and height to understand the data
Cons 🚫:
Computing resource data and charts are not aligned, so it’s not intuitive to understand
Pros ✅:
Computing resources data and charts are aligned, and easy to understand
Cons 🚫:
The chart’s width is too narrow to scroll the past history or see the overall status
Pros ✅:
Computing resources data and charts are aligned, and easy to understand
Cons 🚫:
The chart’s width is too narrow to scroll the past history or see the overall status
Pros ✅:
A wider chart’s width helps easy to scroll the chart
Computing resources data and charts are aligned, and easy to understand
Followed the F-Pattern interface which is the most common user eye-scanning patterns
Cons 🚫:
The chart had few Y-values, so it’s hard to see the detailed chart
Pros ✅:
A wider chart’s width helps easy to scroll the chart
Computing resources data and charts are aligned, and easy to understand
Followed the F-Pattern interface which is the most common user eye-scanning patterns
Cons 🚫:
The chart had few Y-values, so it’s hard to see the detailed chart
FINAL DESIGN
FINAL DESIGN
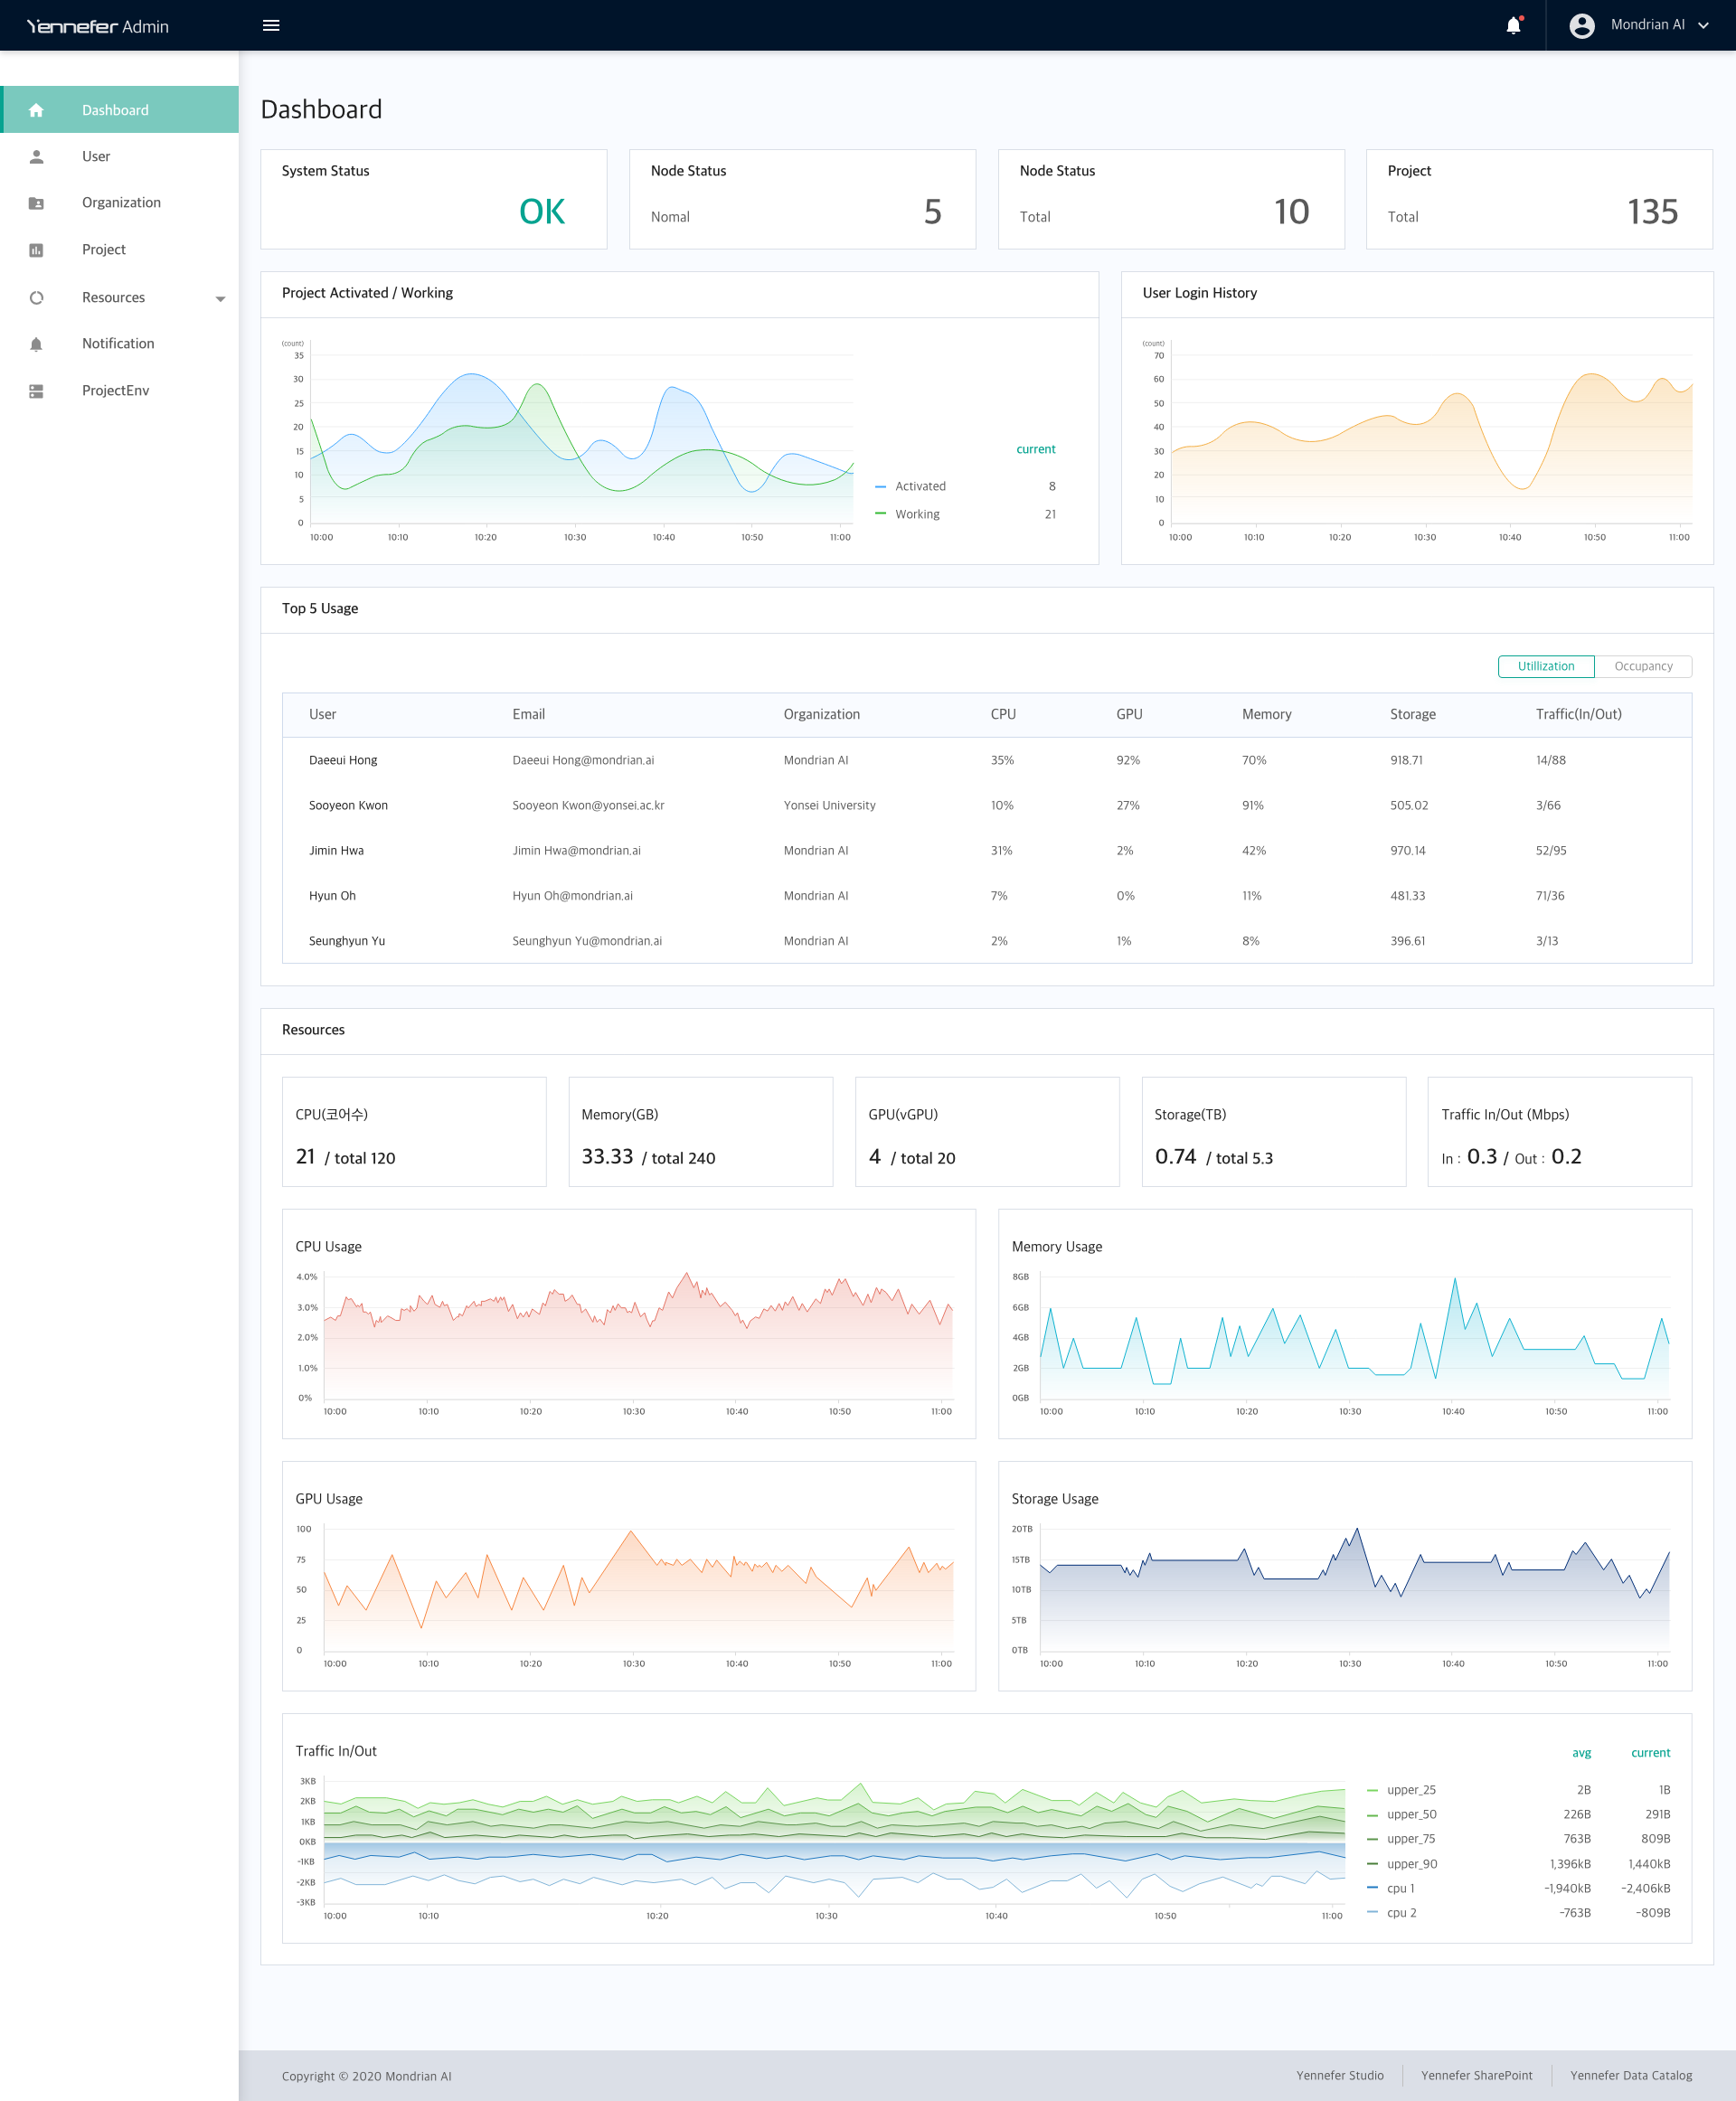
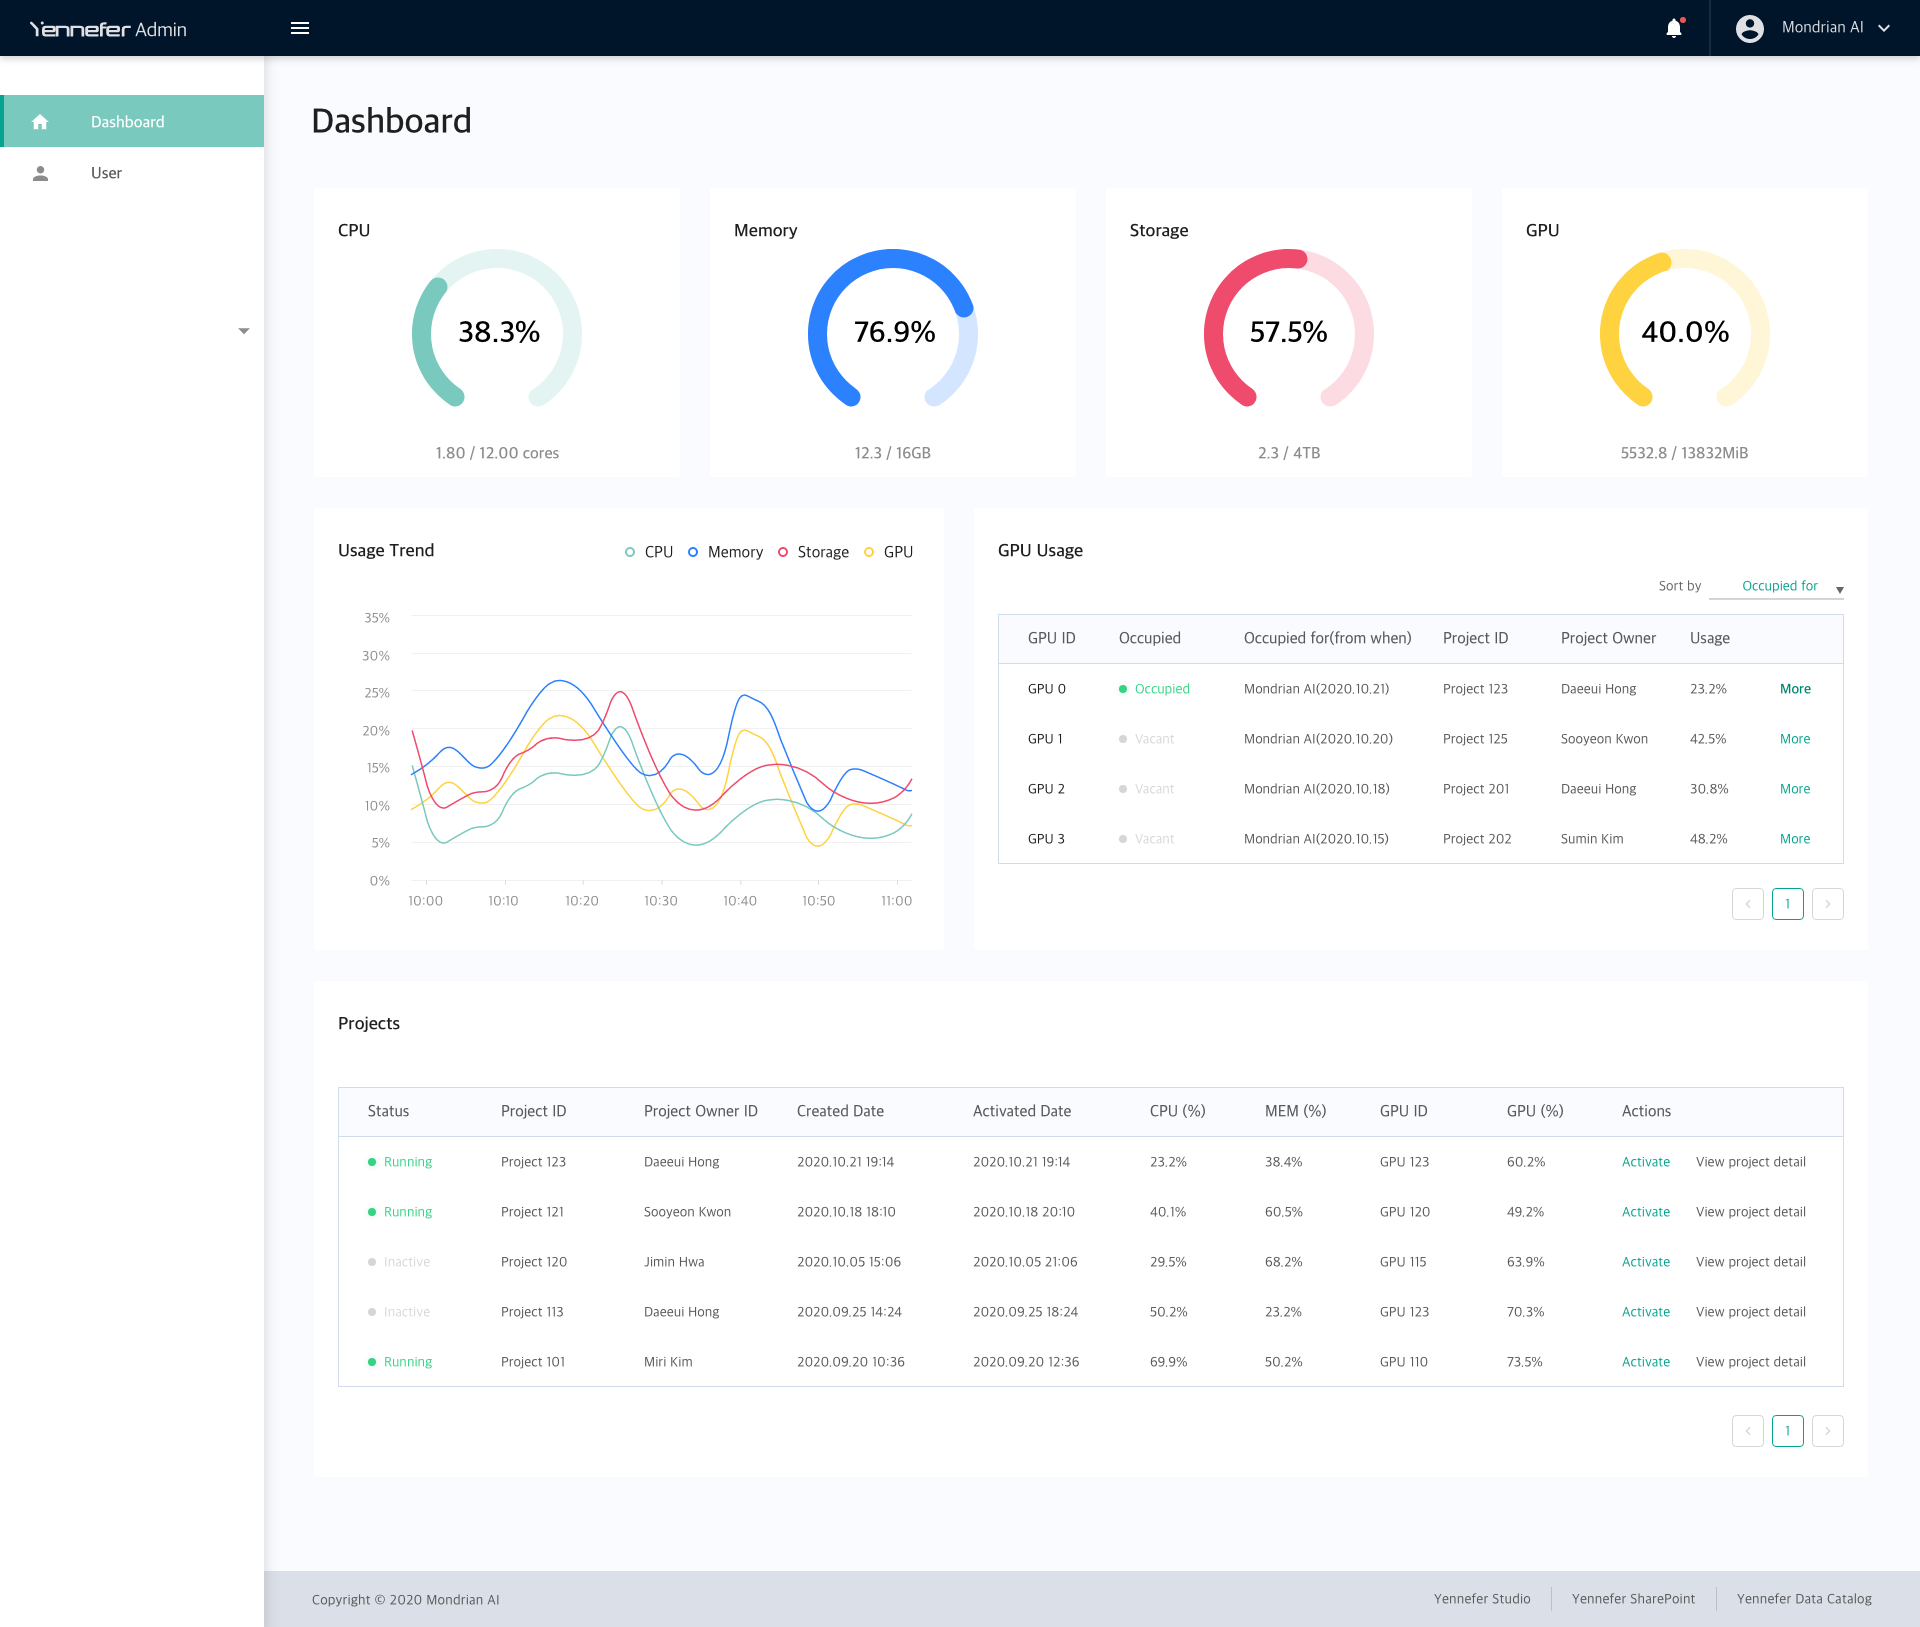
Admin Dashboard
Admin Dashboard
Intuitive Data Visualization
Intuitive Data Visualization
Before
Before

After
After


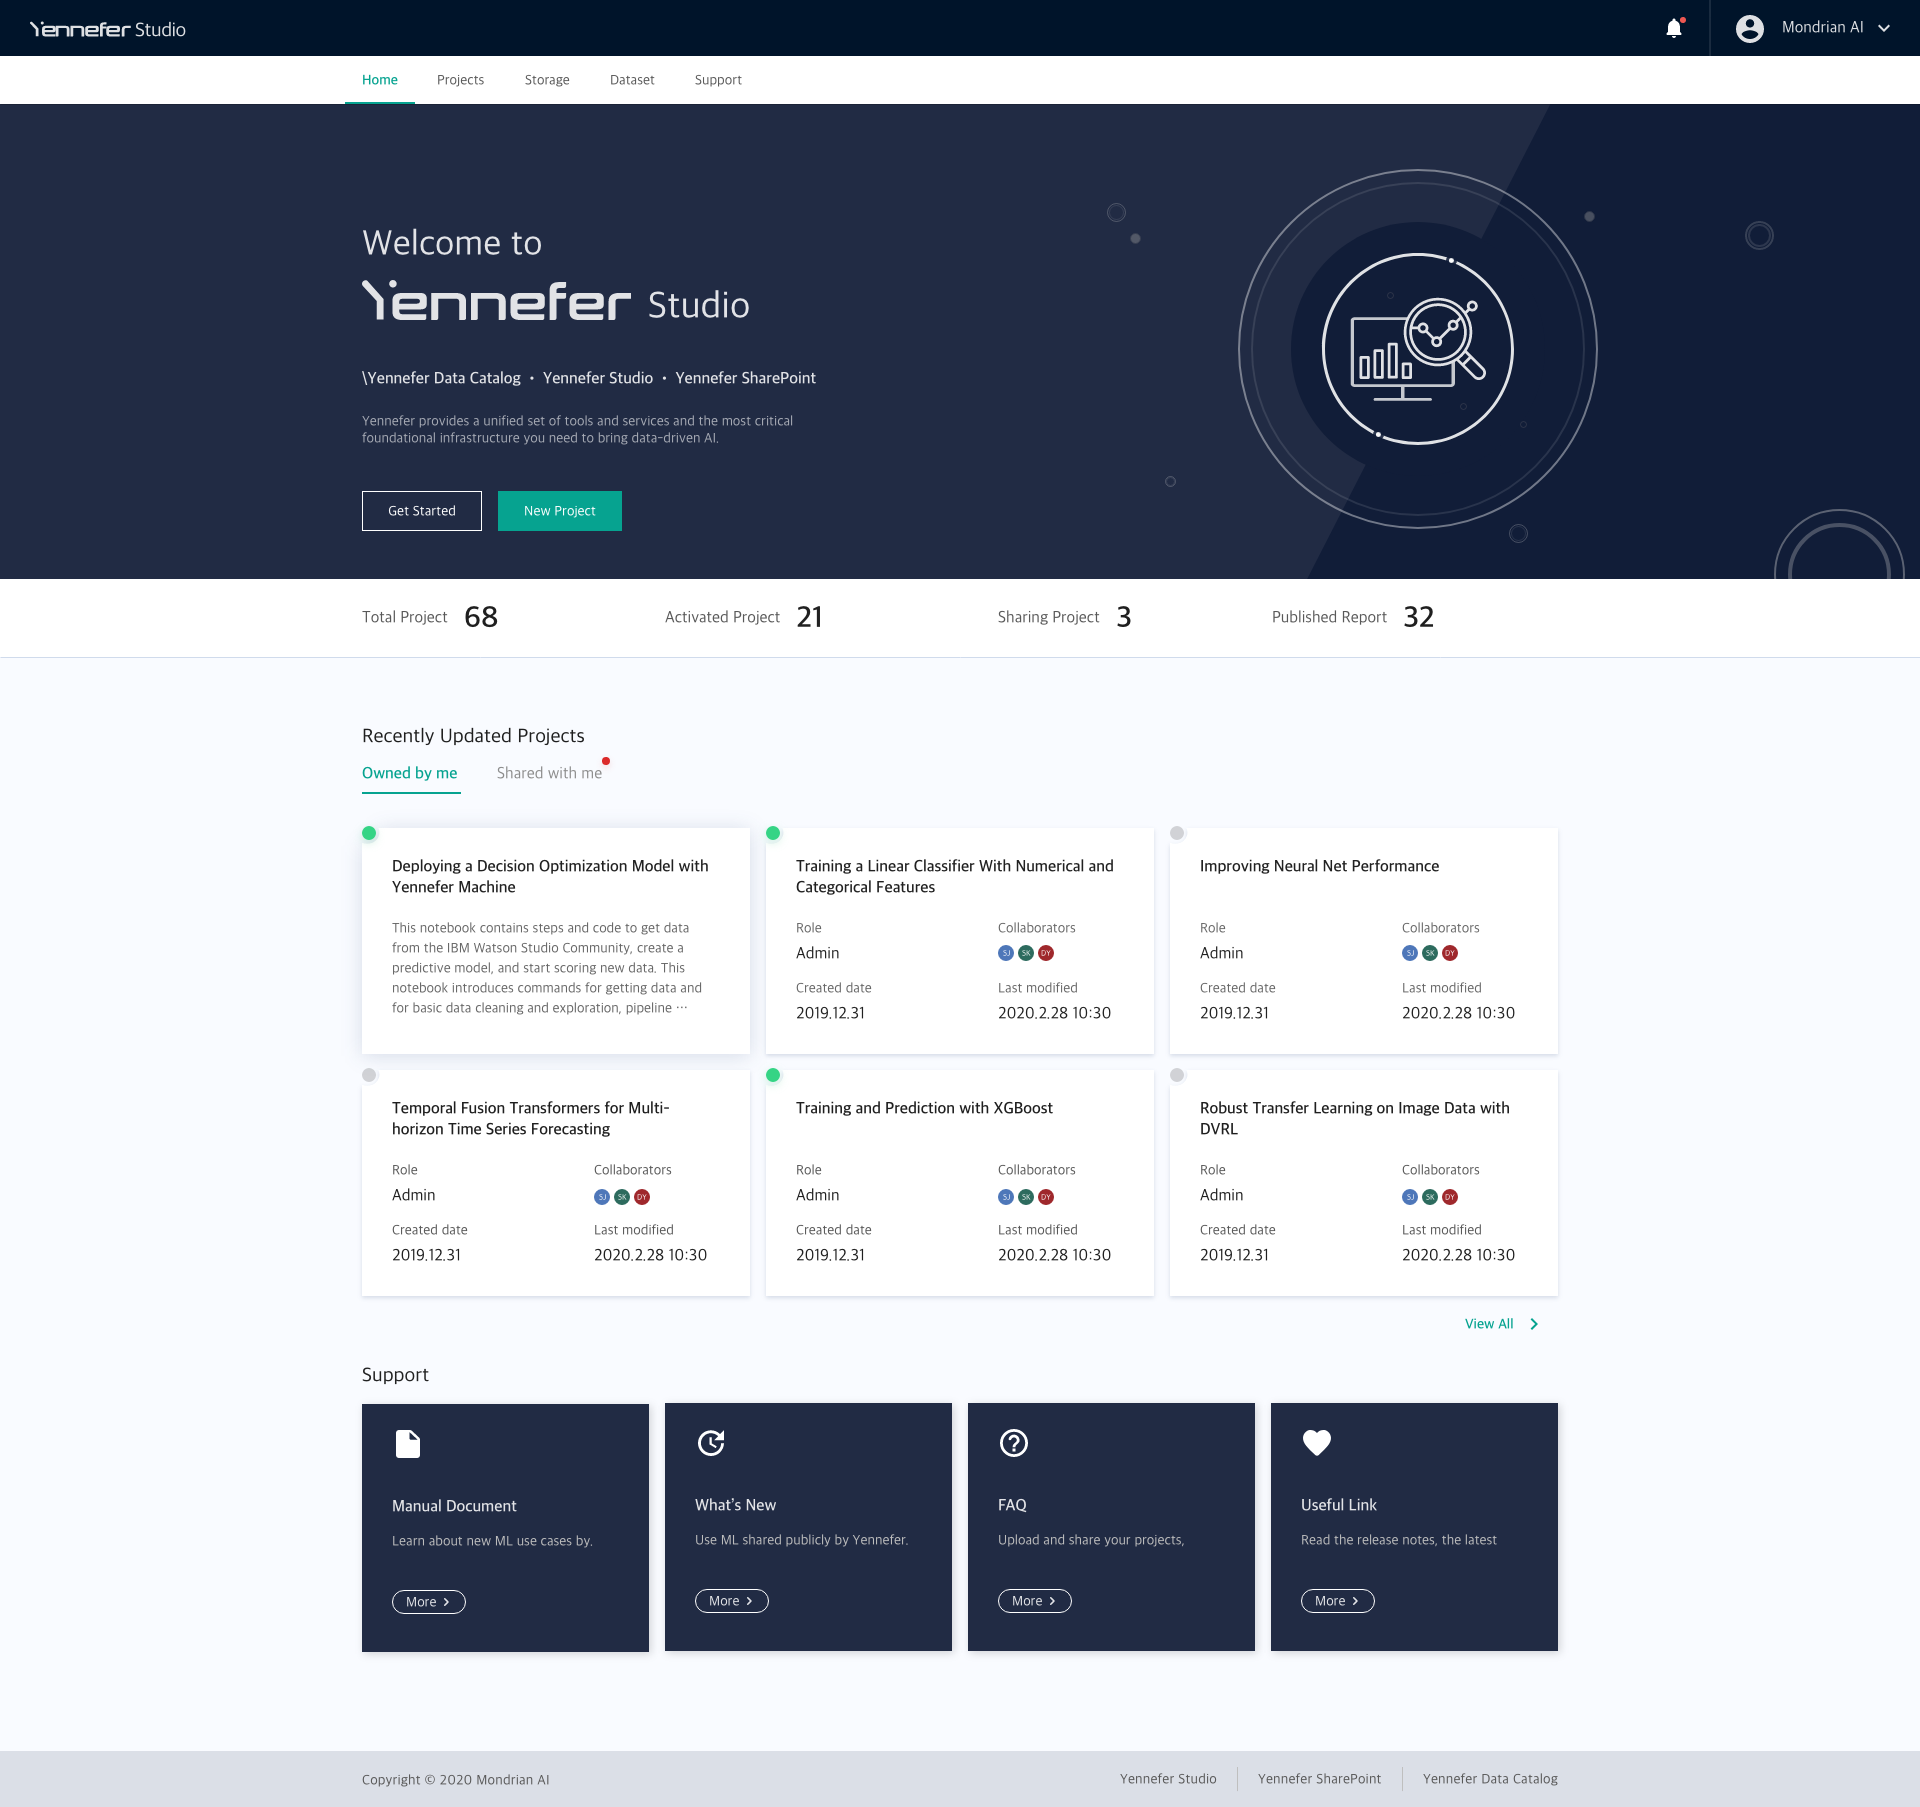
Yennefer Studio Main page
Yennefer Studio Main page
Quick Scan for Project Status
Quick Scan for Project Status
Before
Before
After
After
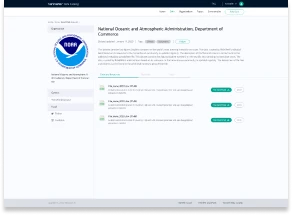
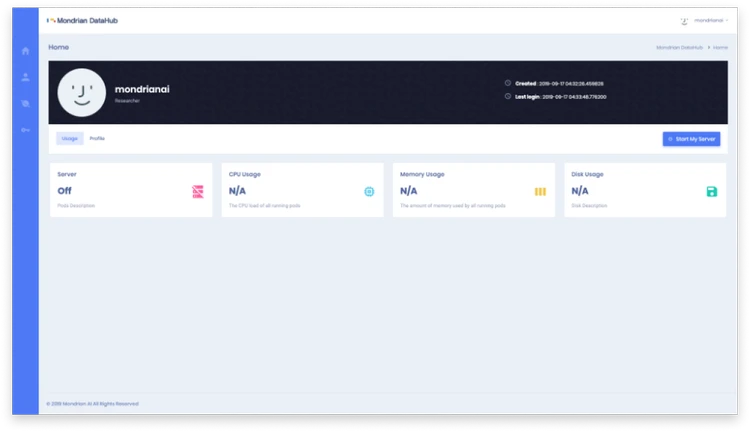
Yennefer Data Hub
Yennefer Data Hub
Instant Access to Data
Instant Access to Data
After
After

Yennefer Studio Main page
Yennefer Studio Main page
Information Hierarchy
Yennefer SharePoint
Yennefer SharePoint
Impact
Impact
Impact
I led ideation workshops that generated 100+ ideas and helped prioritize the final direction using user and business insights.
I led ideation workshops that generated 100+ ideas and helped prioritize the final direction using user and business insights.
I led ideation workshops that generated 100+ ideas and helped prioritize the final direction using user and business insights.
%
%
%
Increased company revenue
Increased company revenue
Customers who used chat showed a 2.5× higher conversion rate, even when the experience was imperfect.
Customers who used chat showed a 2.5× higher conversion rate, even when the experience was imperfect.
Customers who used chat showed a 2.5× higher conversion rate, even when the experience was imperfect.
%
%
%
Increased AI Research efficiency
Increased AI Research efficiency
survey respondents reported positive emotions when interacting with chat.
survey respondents reported positive emotions when interacting with chat.
survey respondents reported positive emotions when interacting with chat.
+
+
+
Adopted by enterprise companies
Adopted by enterprise companies
Adopted by enterprise companies
users needed additional steps after chat because the bot didn’t fully understand their needs or provide clear answers.
users needed additional steps after chat because the bot didn’t fully understand their needs or provide clear answers.
users needed additional steps after chat because the bot didn’t fully understand their needs or provide clear answers.